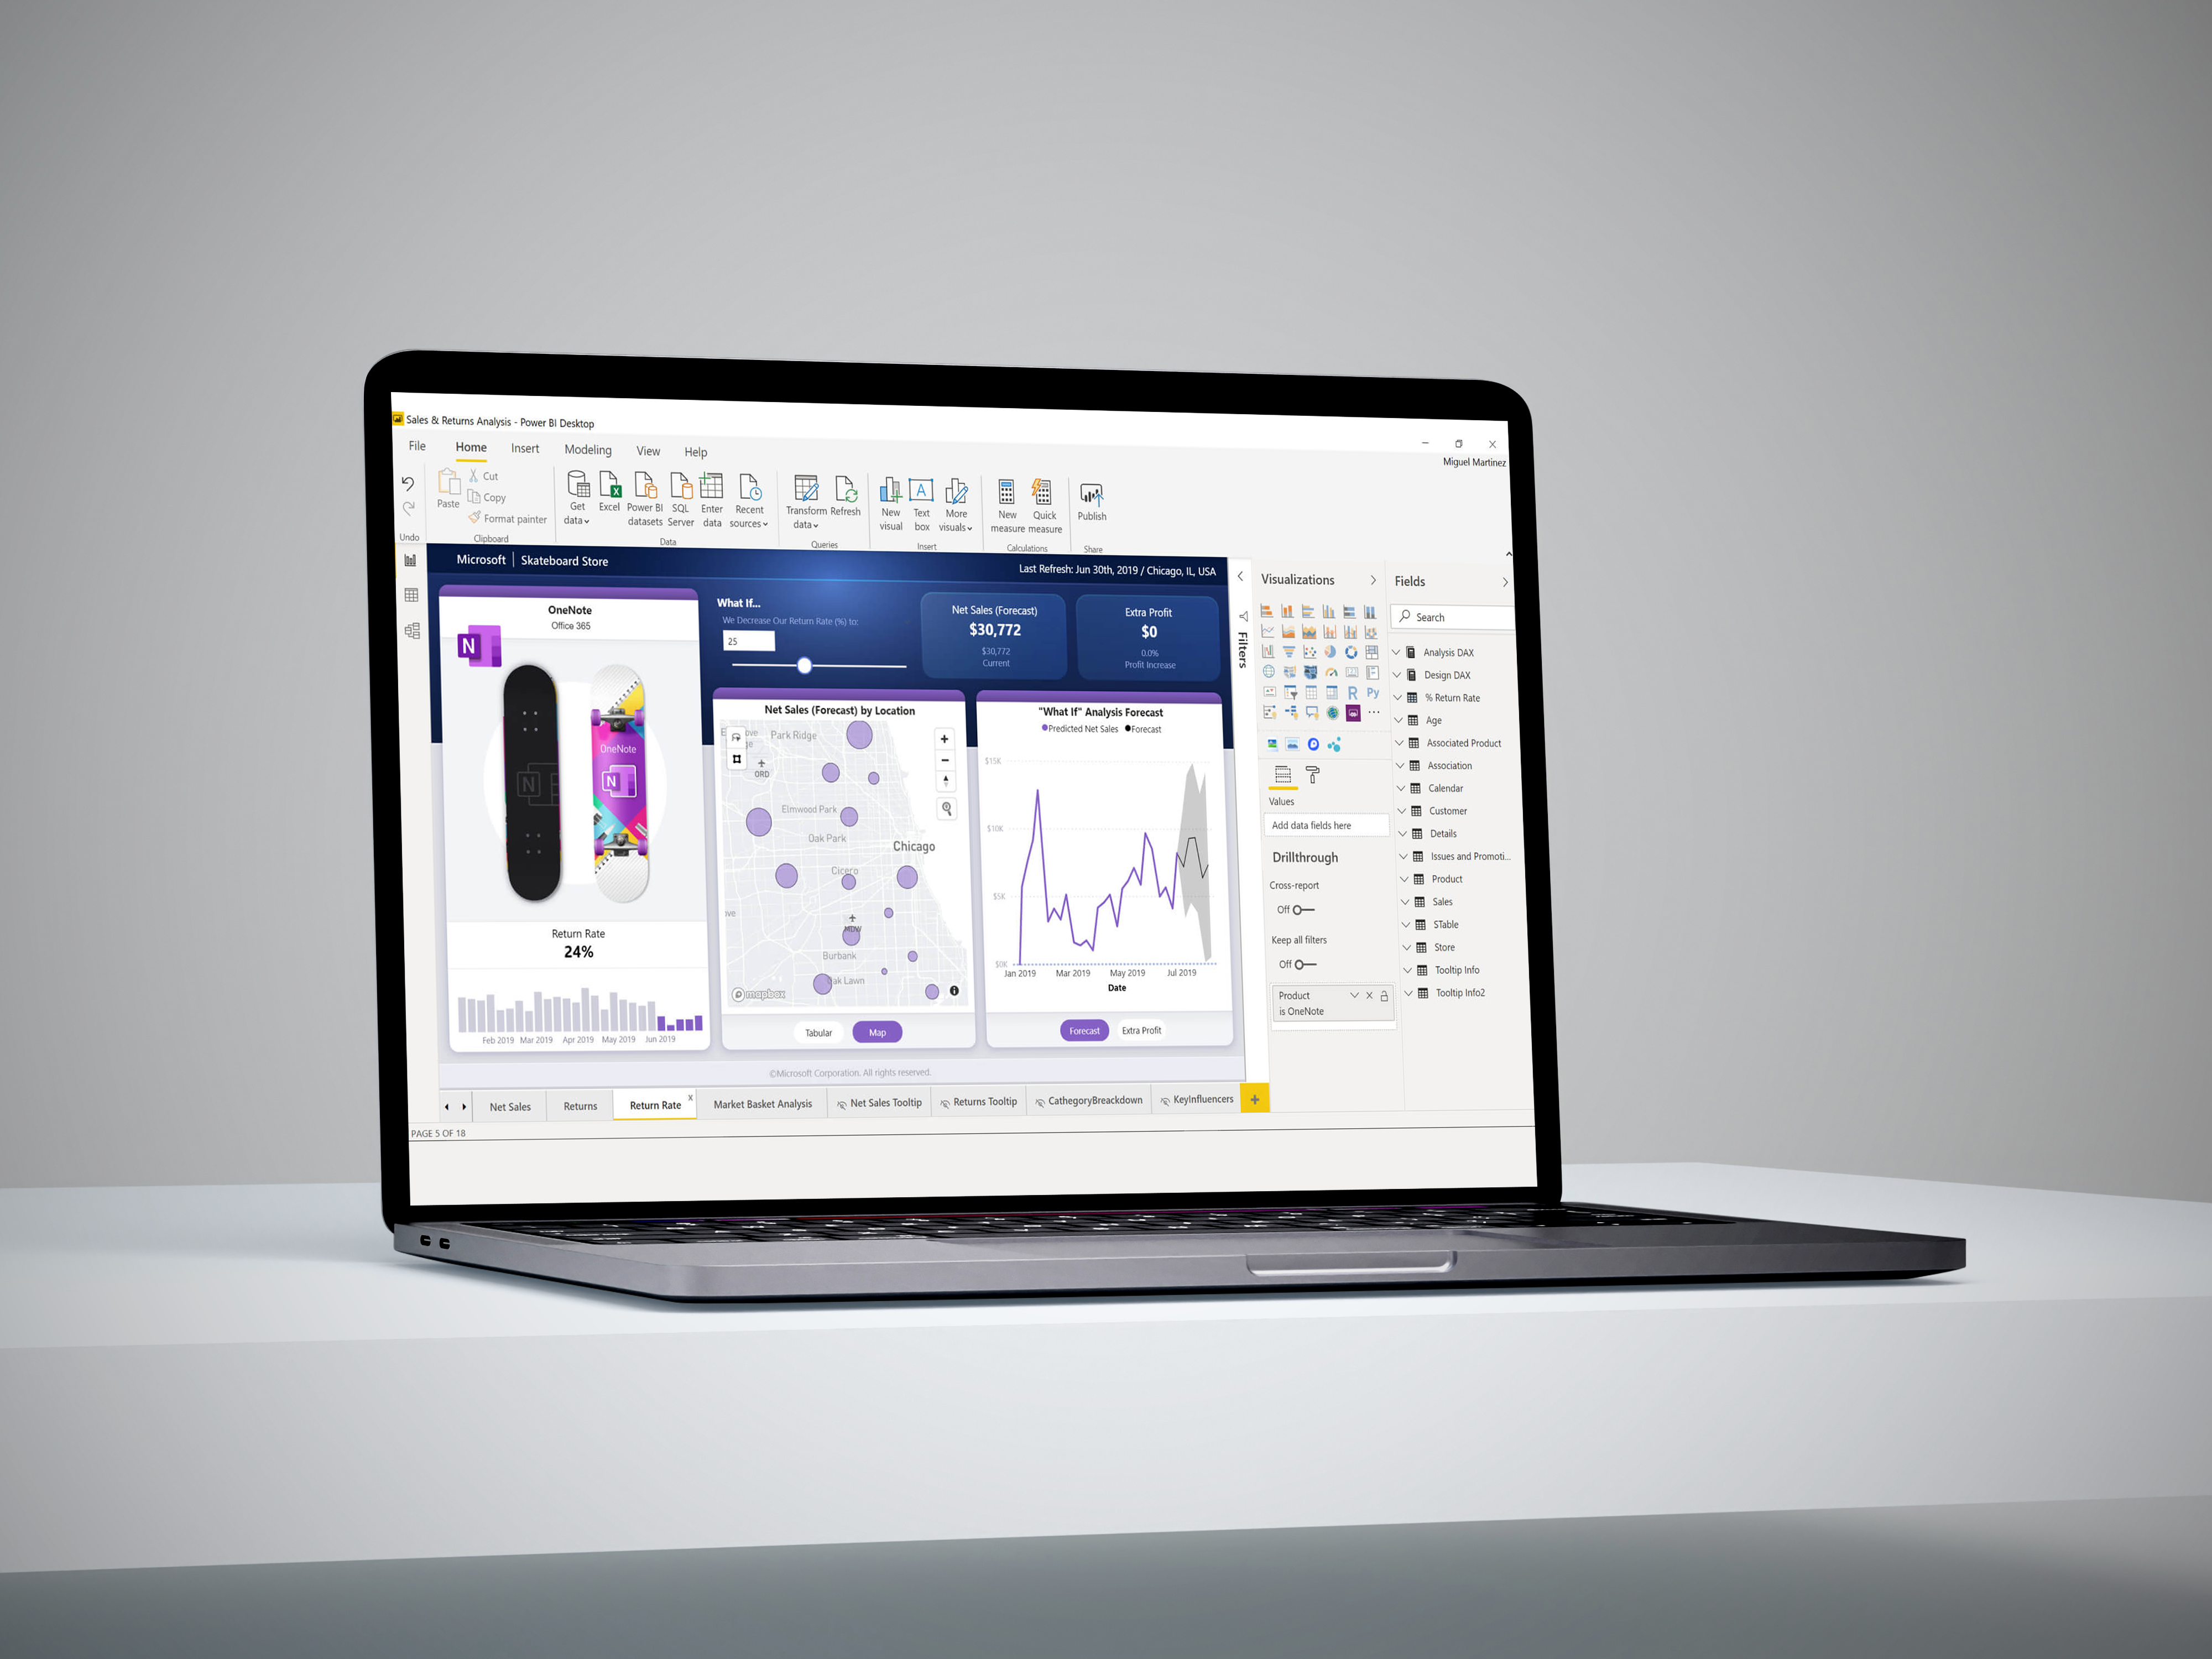
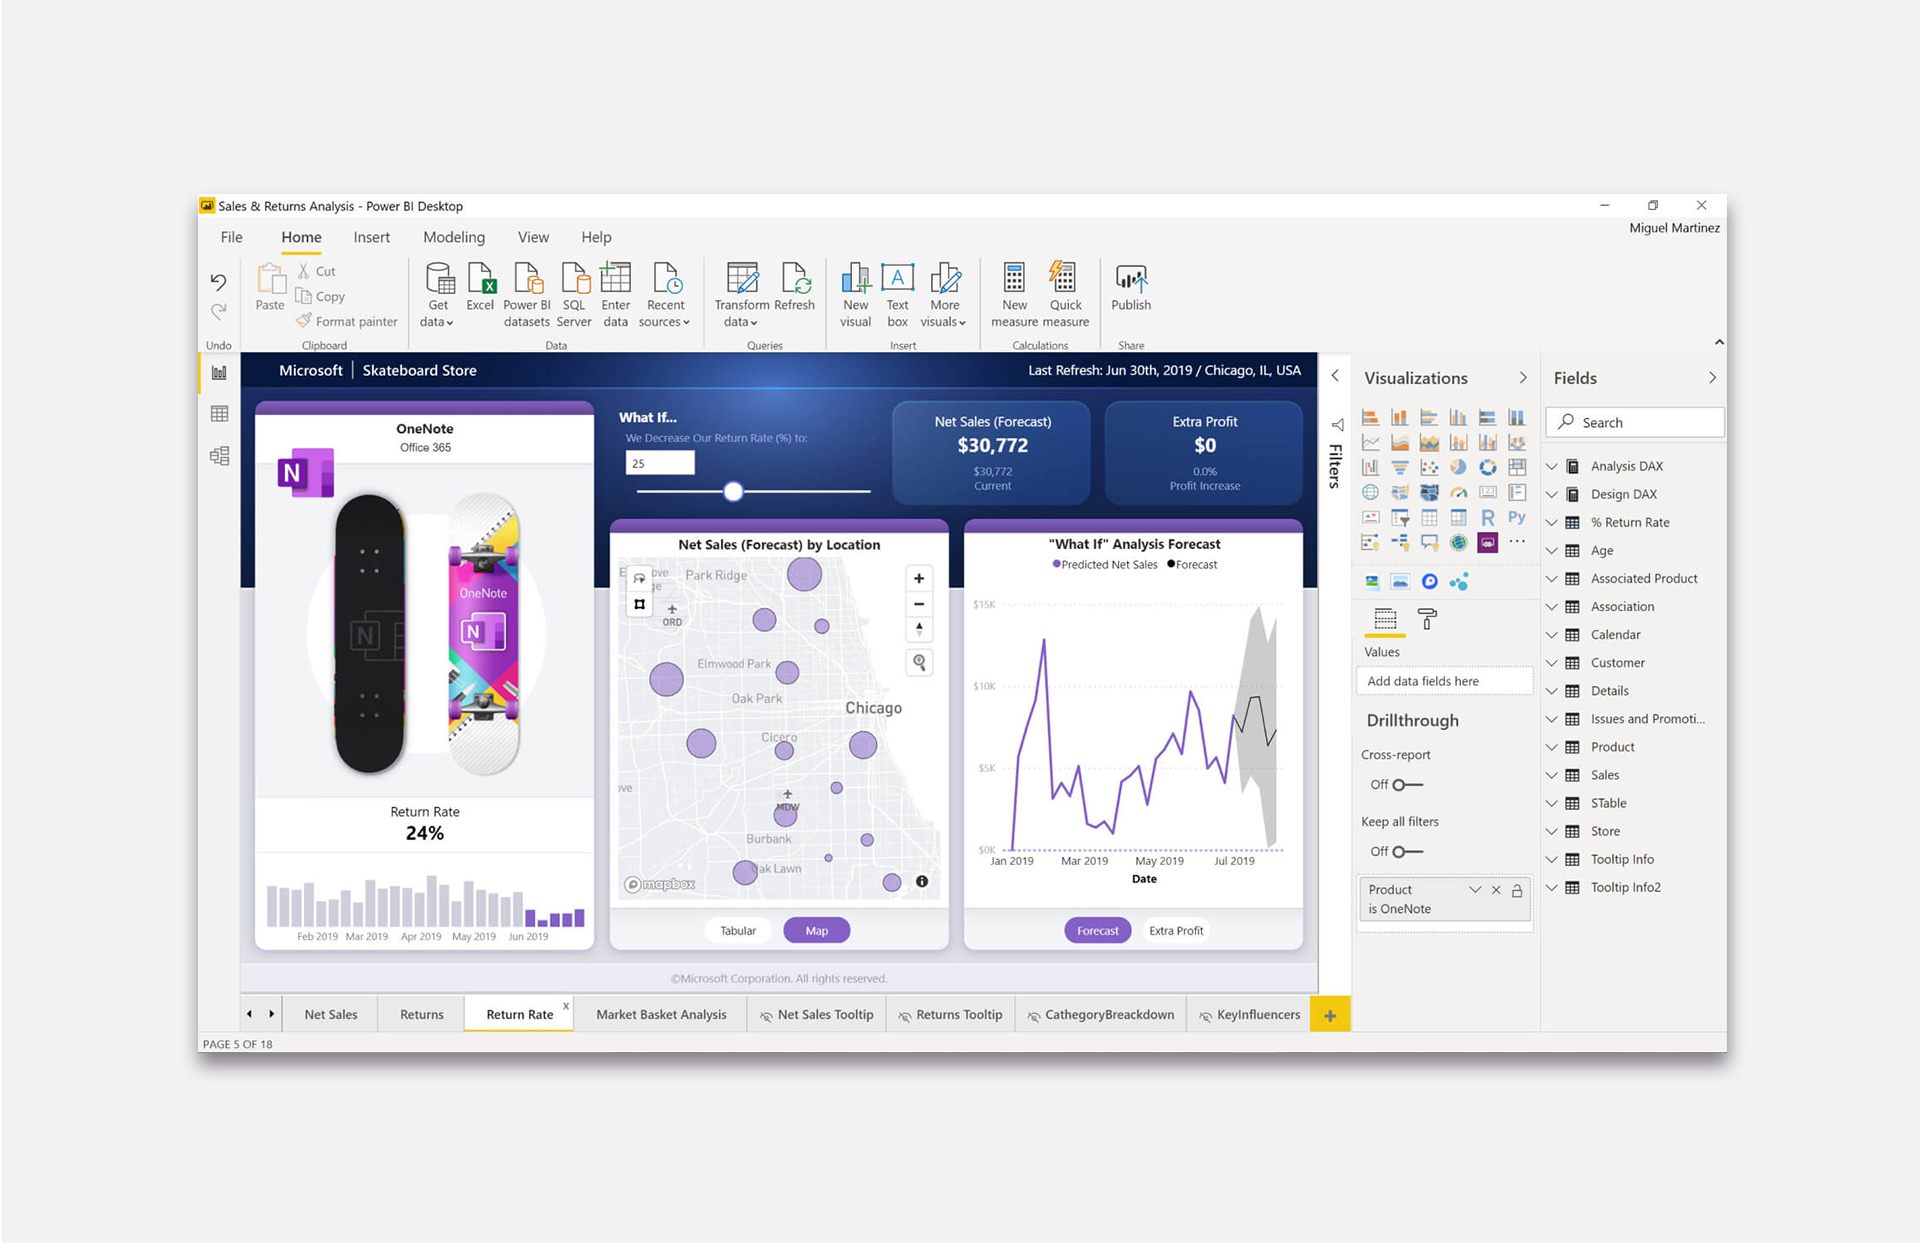
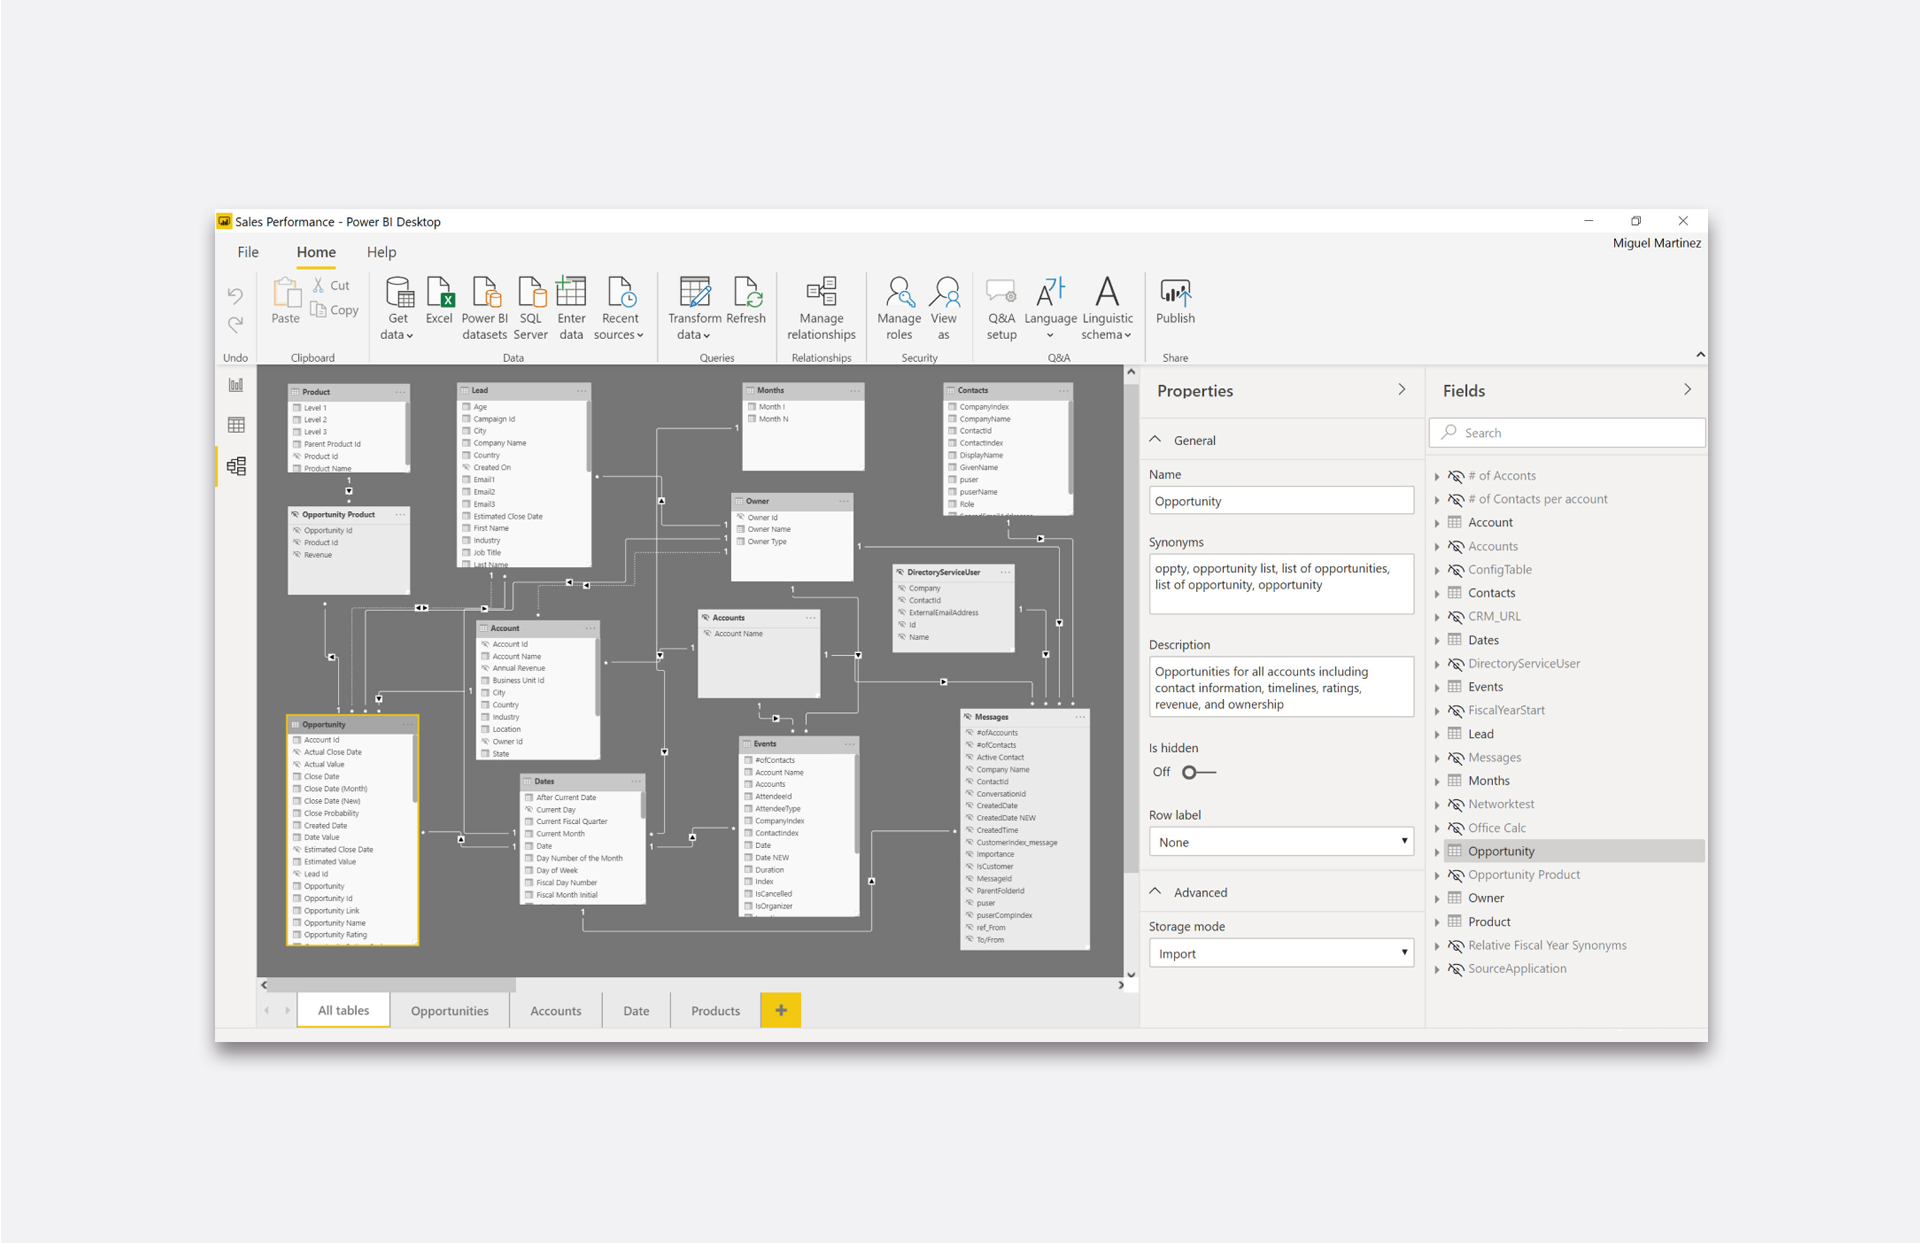
Power BI is really easy and quick to integrate with any Microsoft product. Access and SQL databases, cloud and API storages, and more than 100 other services are just as easy to connect. At the same time, Power BI has connectors that collect unrelated data into a single format. You can work with it using built-in visualization tools. You will have complete freedom of action in building dependencies and creating personalized metrics that are relevant to your business.

POWERBI
Power BI is a Microsoft service program for business analytics. Its purpose is to collect data from various unrelated sources and visualize it in the form of graphs, charts, maps, tables, etc. The service can process any statistical information and helps to structure it. Databases, Excel spreadsheets, cloud storage, CRM, CMS, social networks, and much more can be a source of data for Power BI. The result of the service is personalized interactive reports for analytics. The visualization of indicators helps different departments to quickly compile and automatically update reports for the company's management, as well as investors and business partners.
PowerBI is not the only BI system on the market, but it is the easiest to learn and will suit you best if you use other Microsoft services. Together with Azure and Office, you can build the most efficient technological ecosystem for your company.
To use power bi, you need to download the desktop program, choose a free license, or pay for a subscription with the features that suit your company. The "Premium" version with unlimited users and computing power costs the same as the "Pro" subscription for 450 people with 10 GB of storage for each.
Anyone who knows how to use Excel can work with Power BI without training. The service has all the same tools as the Power Query and Power Pivot add-ins, but they are much easier to use. If you know the DAX formulas, you just need to familiarize yourself with the interface and you can start. To get started, you need to register with power bi, then download data from sources, group them, process them, and present the results in a graphical form. Then you can publish the finished report on the server.
All visual representations of metrics can be interactive and updated at a specified interval. If you specify a threshold value for a KPI, Power BI can send a notification when the mark is reached. If you use Power Apps and Power Automate, streaming analytics becomes available for any actions in applications and social networks, as well as robots connected to the sensor system, including in production. This is very convenient for quick response in various cases, such as canceling an unprofitable advertising campaign or tracking other critical indicators.
The virtual service for publishing your reports allows you to select other users who will have access. They can view the dashboard from the desktop version of the program or in the free app for iOS and Android.
Microsoft products have a very high degree of data security compared to competitors. All information within the system will be reliably protected, regardless of where you get the information from, what formats you export it to, and with whom you share it. Power BI is one of the youngest platforms, and therefore it is regularly updated. By choosing this service, you get both the stability of an industry leader's product and constant additions. Since the service is paid, you can and should contact support to resolve any issues, even those related to updating power bi or creating a specific type of chart.
Power BI Premium is designed to meet the needs of large companies. You'll get access to Azure Data Lake servers that can handle any amount of data, as well as machine learning systems that allow you to use text and even images as data sources.
Power BI is a convenient tool for monitoring any indicators and trends, comprehensive analytics of the current situation, and forecasting based on data models. The system can be used in the marketing and finance departments, in production, and for personnel management to evaluate various coefficients and dependencies. Its main purpose is to simplify management decision-making at all levels.
All prepared reports can be published on Microsoft hosting, including connecting corporate databases to them to update the data in documents on a schedule. Such analytics can be viewed by those who have access, both from the desktop application and from mobile applications for iOS and Android.


