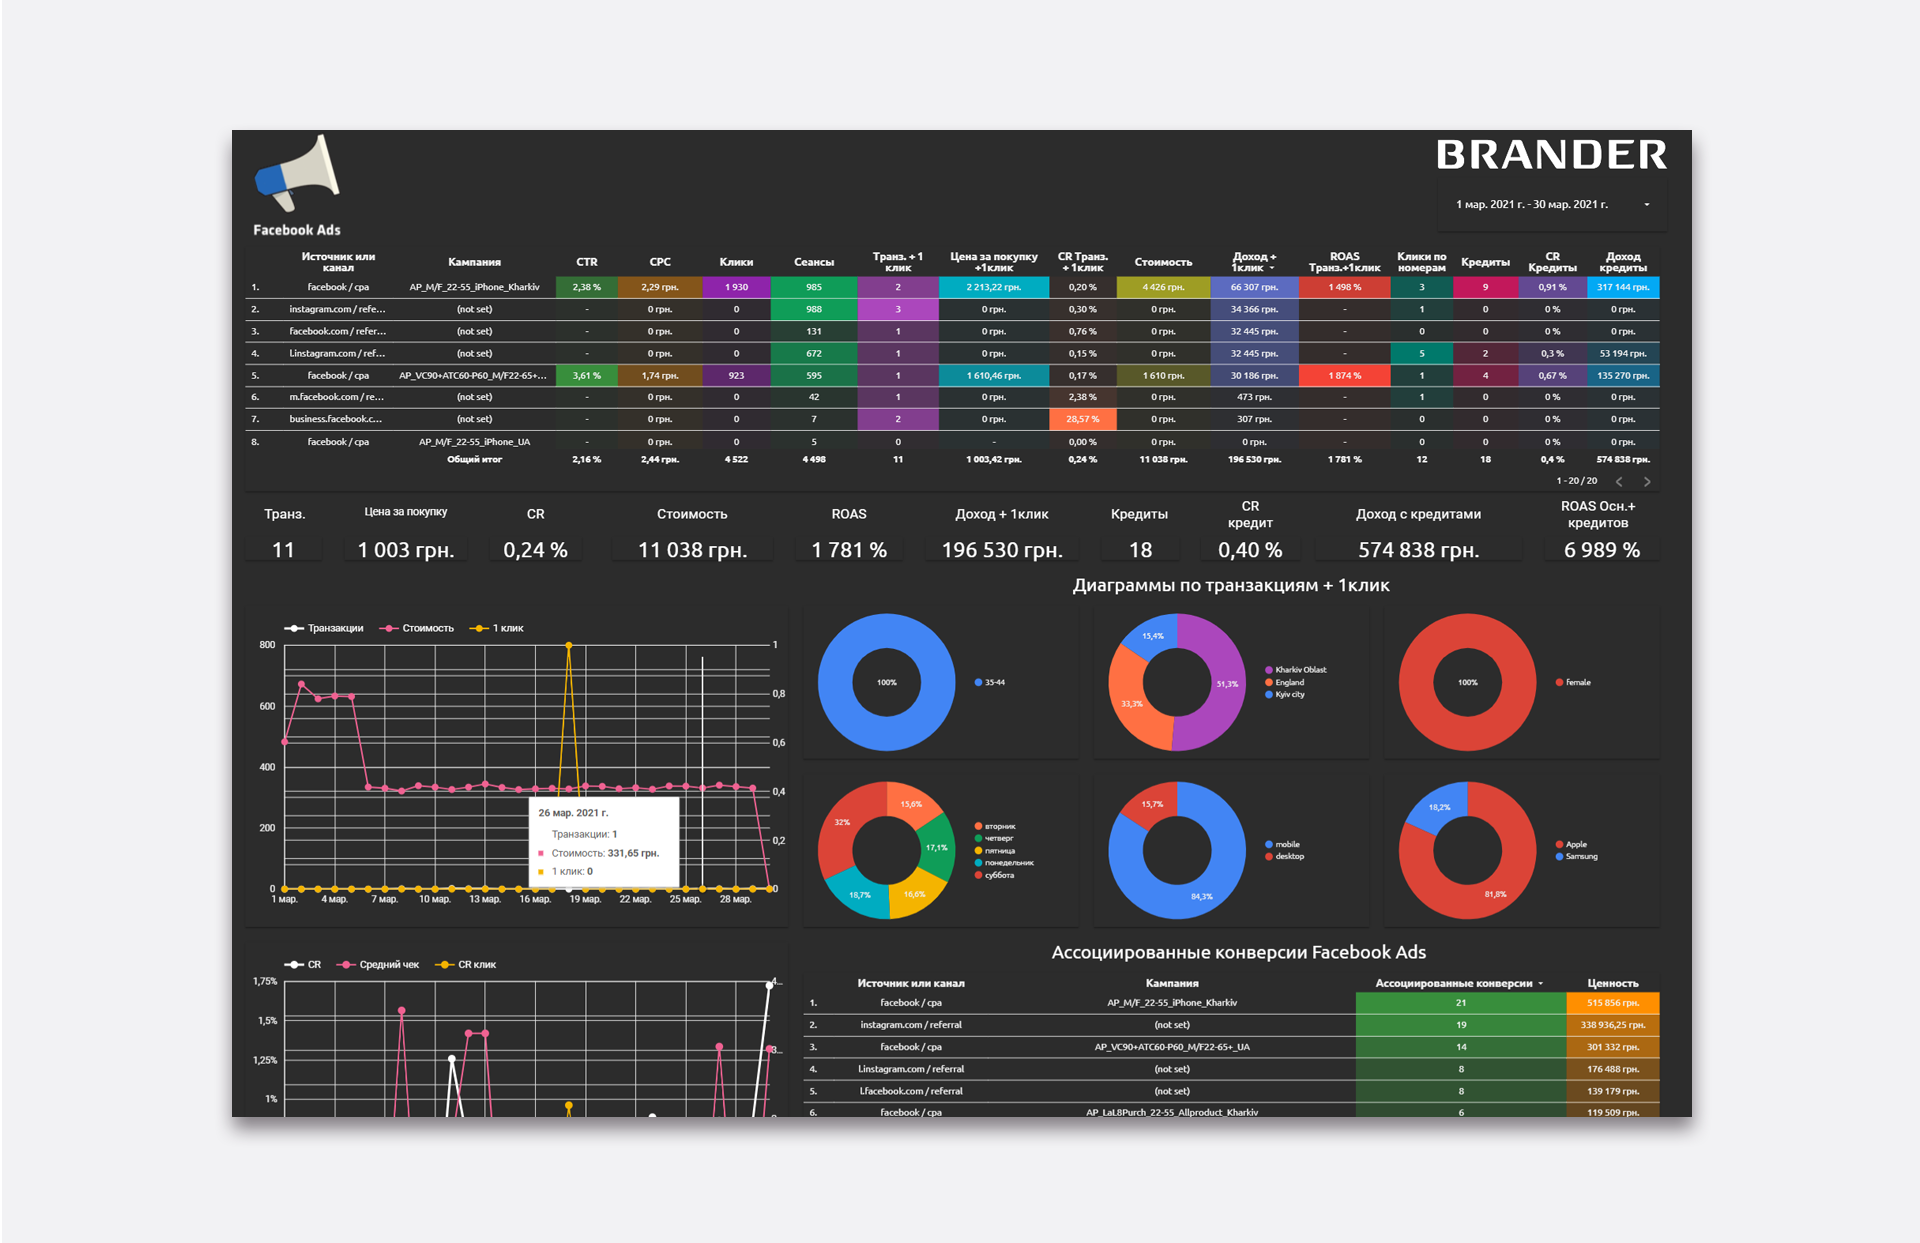
Data Studio has connectors for almost all Google systems, from Ads and Analytics to YouTube Analytic, and most importantly, BigQuery. If you upload all the data to this storage and process it there, it will be even easier to work with Data Studio as a visualization tool. There will be less routine work on organizing the upload, and there will be no errors that sometimes appear when you import directly from Google Analytics. In addition, in this case, you will not have the limitation of combining data from a maximum of 4 sources.

DATASTUDIO
Data Studio is a Google service for comprehensive analytics of advertising campaigns and visualization of their results in the form of graphs. It is the simplest and most versatile tool for collecting and processing reports from Google Ads and Google Analytics, which are connected with a single button, as well as other Google programs.
Data Studio is a free software with an intuitive interface that can generate beautiful reports that reflect changes in real time. To analyze and visualize not only marketing tools, but literally any data from various CRMs, databases, and even signals from sensors, Google has a separate paid service called Power BI. OWOX BI and toolkits from other developers are also suitable for the same purposes.
To start working with Google data studio, you just need to log in to this service from your account. Next, you need to connect your data sources and start creating your report. In the simplest cases, you don't even have to spend time developing your own graphical representation and just use one of the many templates. To make your report personalized, expand an empty workspace and upload charts of the desired type from a dozen available options, and then customize additional elements. In data studio, you can set a date range, filters by various parameters, such as campaigns, cities, ads, etc. The service's friendliness to new users is also confirmed by an extensive section with training materials.
One of the reasons why Google Data Studio is so popular is the ability to create really informative and beautiful reports. You can customize the appearance of all visual elements as you want, including corporate style, insert shapes, text, images, and videos. The report itself can be multi-page and as detailed as you need. You can use more than 10 types of charts to visualize various relationships, as well as tree maps, metrics counters, and more.
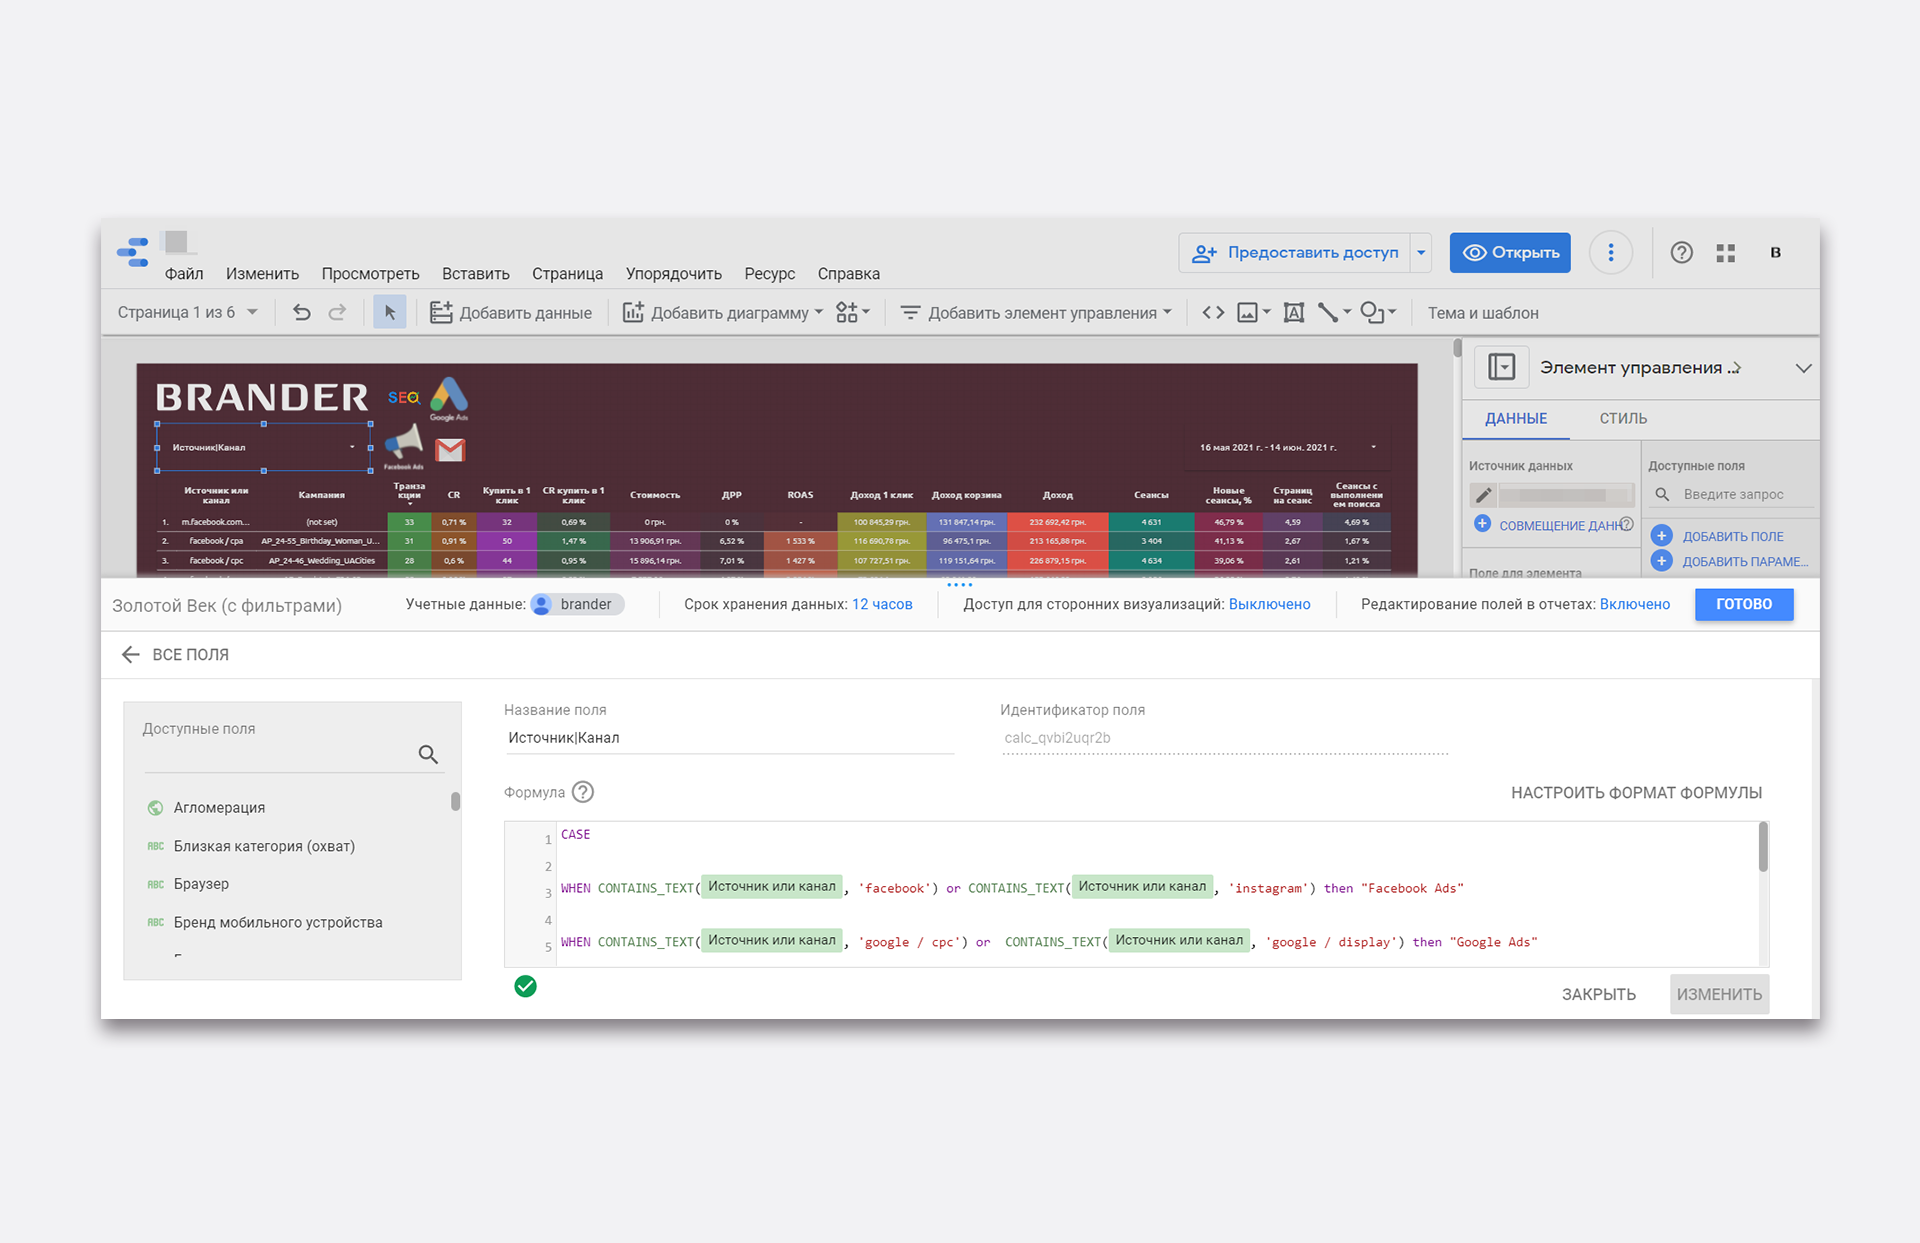
Data Studio's calculated fields allow you to create your own metrics. You can write any formula that uses data from sources and then apply it in your report. Including in graphs and charts, linking to other metrics.
Marketers can not only share ready-made reports with colleagues, management, and investors, but also give them access to edit them. This can be done in any browser, including a smartphone or tablet, although the service is not optimized for some devices. Such access to reports is convenient for remote collaboration and quick decision-making.
Google Data Studio is a simple, intuitive, and free reporting tool. It is well suited for visualizing the results of marketing strategies and advertising campaigns, but it can also be used for other business purposes. Data Studio has an excellent visual editor that is a pleasure to work with and saves time. Data Studio integrates with Google products more easily than other services, is able to reflect changes in real-time metrics, and allows you to organize effective remote teamwork on reports.


