In order to effectively manage your Magento online store, you need to have up-to-date and reliable analytical data. It allows you not only to monitor but also to improve the performance of your store, choose new strategies, look for new approaches and development vectors.
And today we are going to talk about how to use up-to-date analytics tools, understand key indicators, improve performance, and develop your online store based on analytical data.
How to Use Google Analytics
Google Analytics is an effective and free tool for website analytics. If you integrate it, you get a lot of important information about:
- user behaviour on the site;
- website traffic;
- user interaction with the content.
Analysing these indicators allows you to understand how users find your site, how they behave on different pages, what attracts new customers, and what can be improved. All this information is a kind of foundation for developing strategies and making important decisions in the future.
Working With Conversion and Bounce Rates
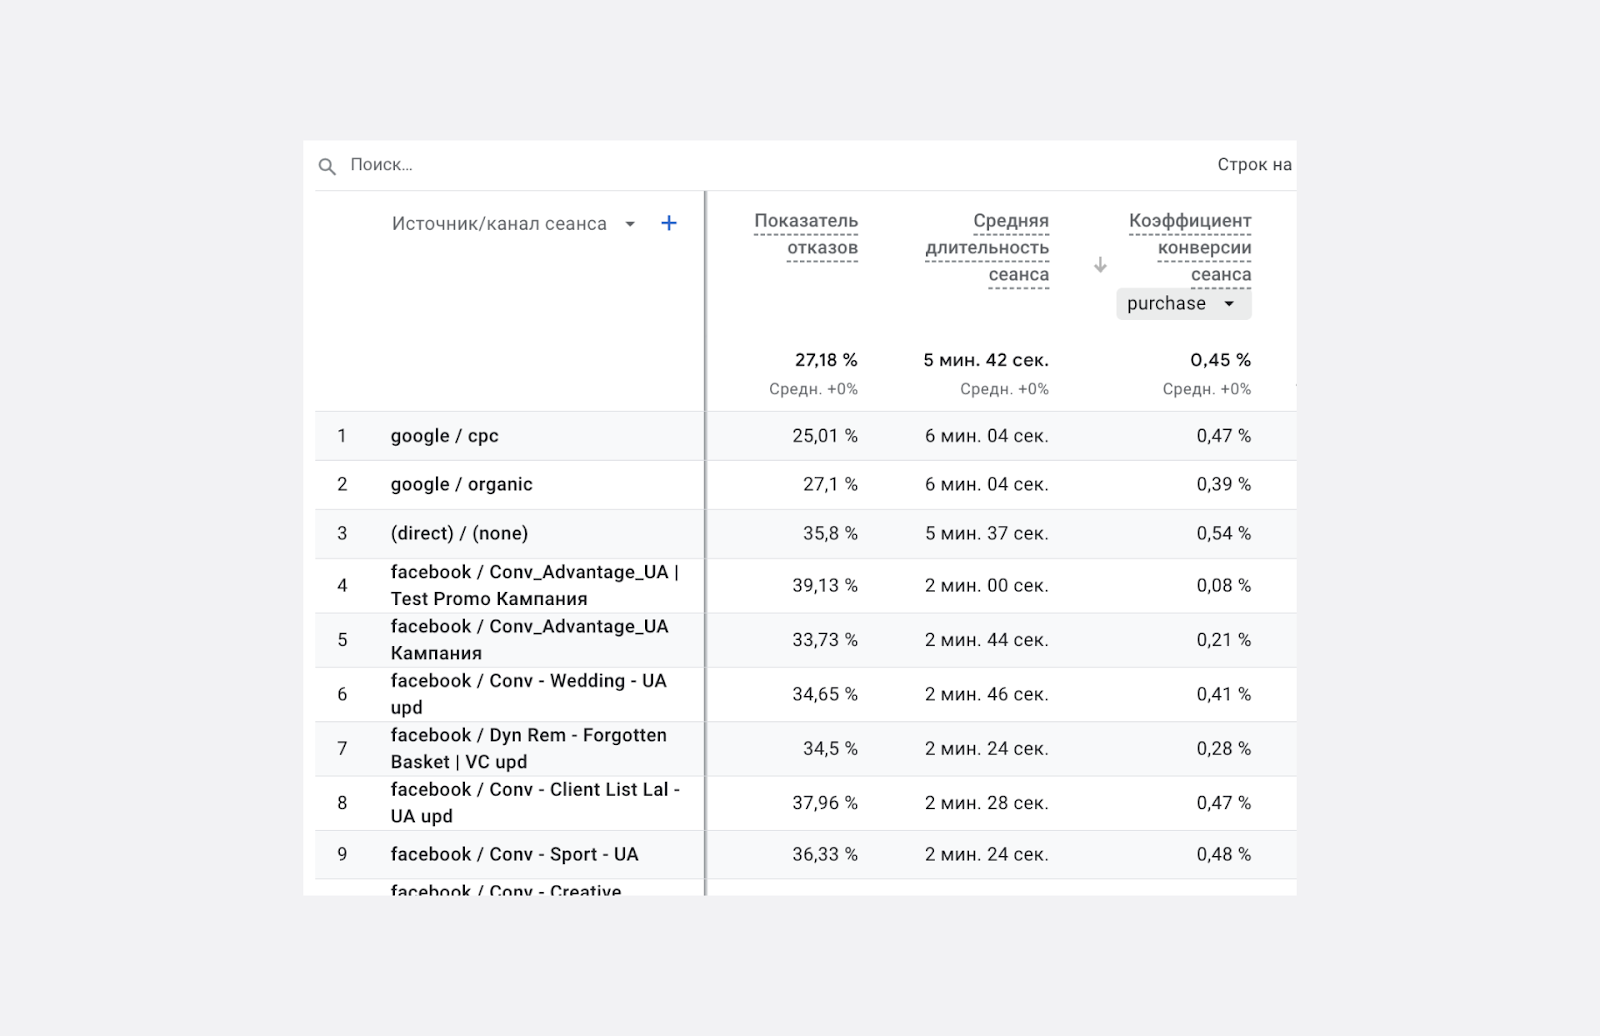
Understanding conversion and bounce rates is one of the key tasks of analytics.
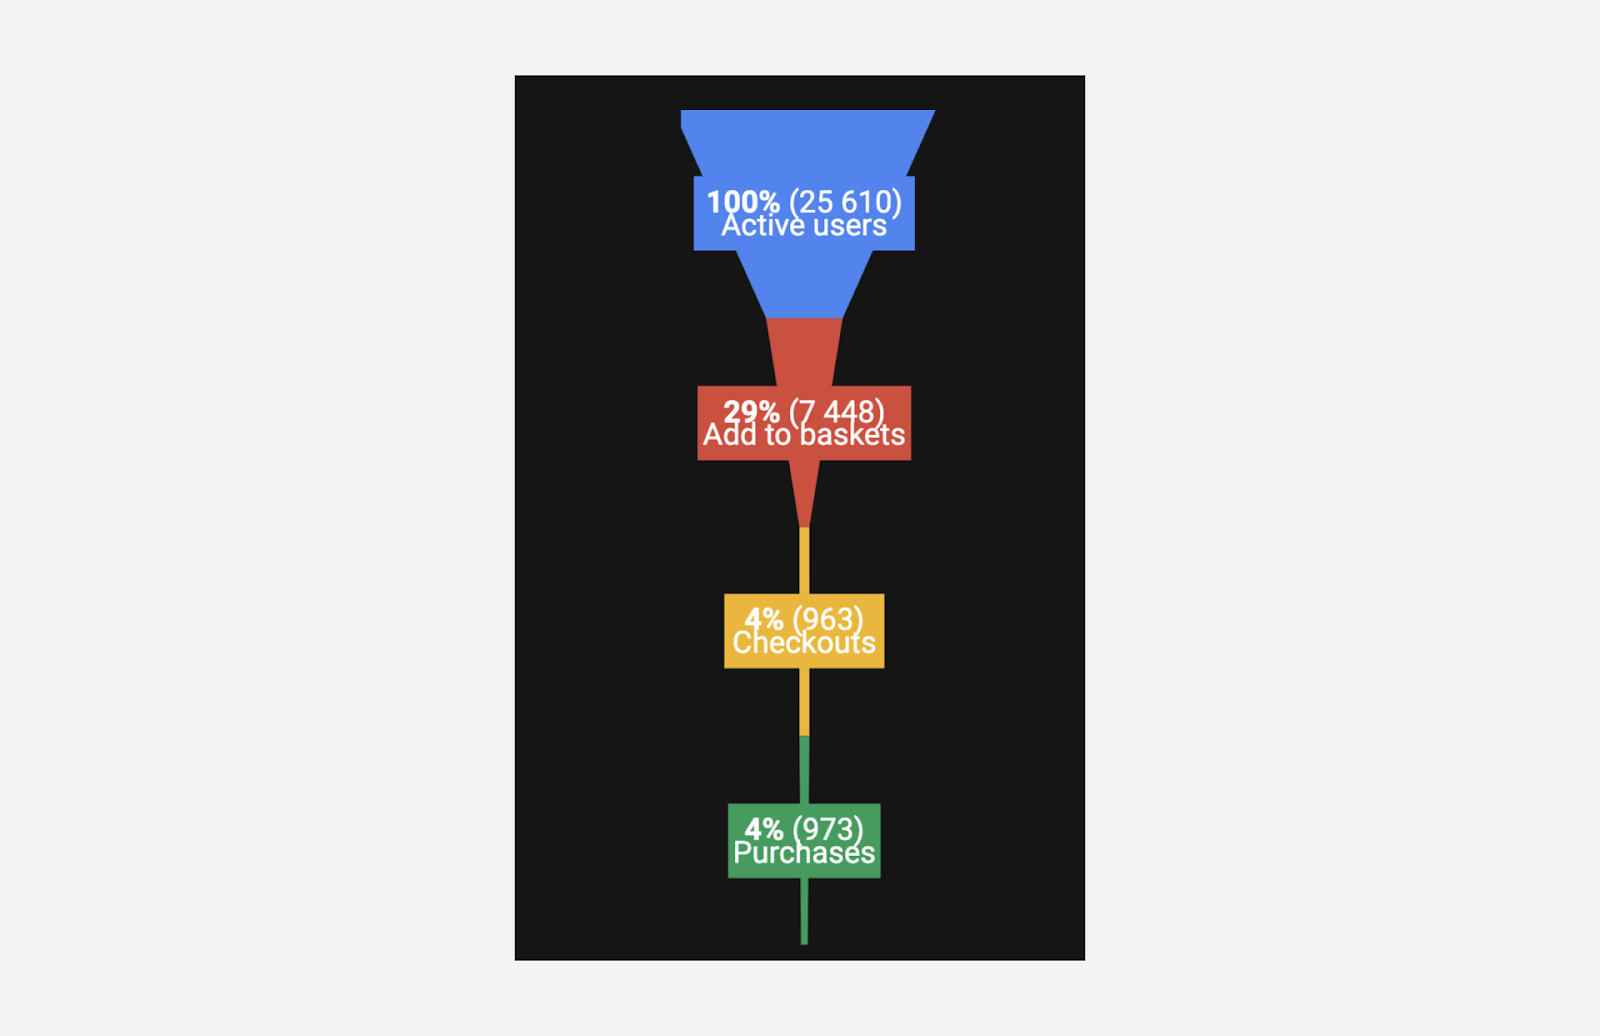
Conversion rate is an indicator of the number of users who have completed a targeted action: purchase, order, subscription to a mailing list.
Bounce rate — clearly demonstrates the percentage of users who left the site without performing the target action.
Analysing these metrics allows you to identify weaknesses of the site, understand the stages of interaction with the store where the user becomes uncomfortable and closes it.
The main thing is that you can understand the reason for the loss of potential customers, work through it, find a solution, and fix the situation.
Improve Performance Using Analytical Data
Google Analytics will help you with this point again. Among the most common reasons that affect the performance of an online store are the following:
- slow page loads;
- incorrect display of content on different devices;
- technical errors.
Working with this data will help you identify weaknesses and work on fixing them.
Heat Maps and How to Use Them
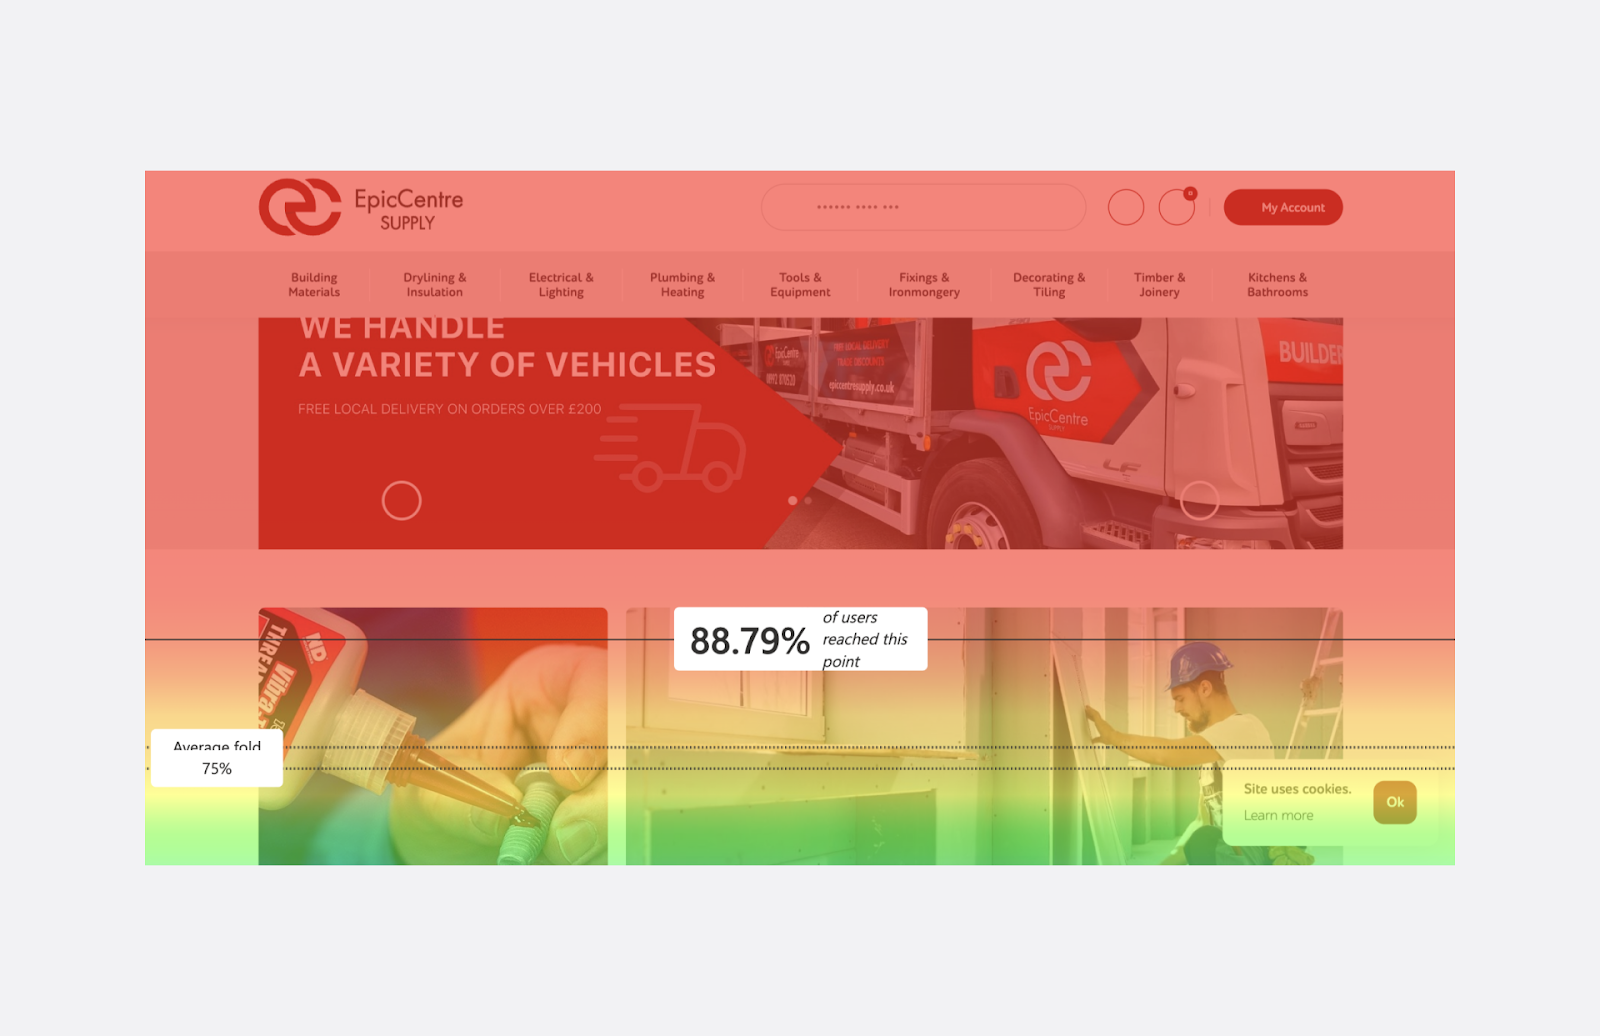
Heatmaps and click analytics are additional tools that can be used to evaluate user behaviour on a website in more detail.
These tools allow you to visually see how users interact with different elements and parts of the site. Heatmaps show the areas where users have focused their attention. Click analytics shows the interaction between the user and various elements of the page.
Thanks to this data, you can optimize the location of icons, site elements, and buttons. Optimizing these elements will help you increase conversions.
Conclusions
Based on data from Google Analytics and other analytics tools, you can make decisions about future development. The analysis of metrics and user behaviour helps to understand which marketing or technical strategies give the best results.
You can clearly see weaknesses and quickly strengthen them, change the vector of development, or abandon them altogether and redesign them. This is the most effective approach. It ensures business development.


